Contents Show
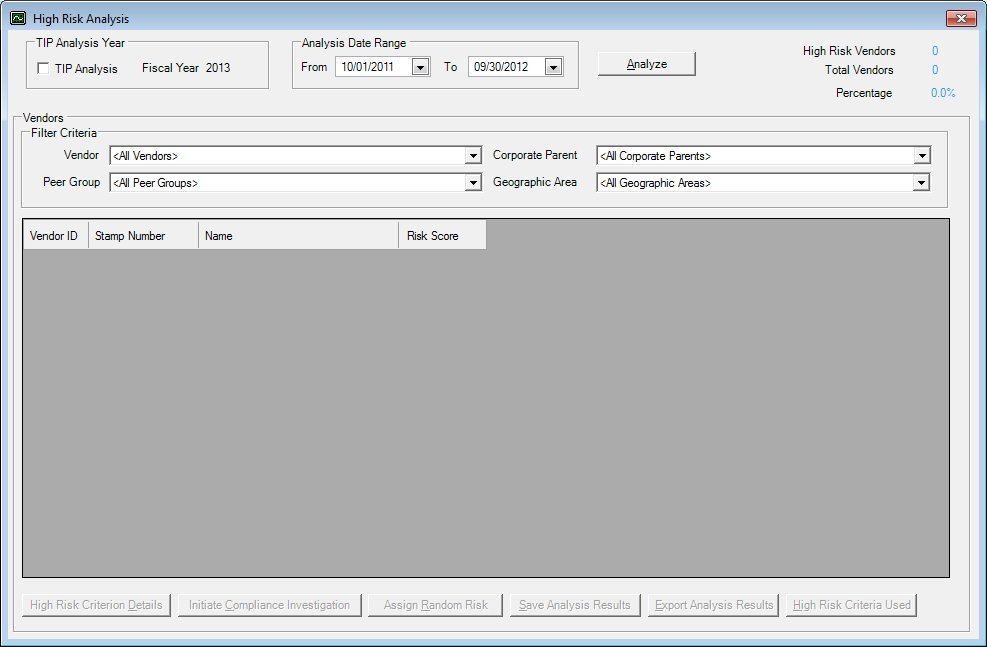
The High Risk Analysis screen is used to calculate the high risk score and automatically assign the various risk indicators for all vendors.
If the user is generating a high risk report and performing a high risk analysis, the results will not be the same. Either the report should be generated or the analysis should be run. For information on generating the report, consult the Generate High Risk Report topic.
High Risk Analysis screen
|
|
Interface InitializationUpon initial display of the screen, the following occurs:
|
Unless otherwise stated below, all controls on the High Risk Analysis screen are visible and enabled when:
The screen is active.
If one or more special conditions exist that affect a control on the High Risk Analysis screen, the condition(s) are documented for that specific control below.
Complete the information in the TIP Analysis Year group box.
The group box includes controls to specify the TIP analysis year. The title text of the group box is set to "TIP Analysis Year". The following controls are included in the group box:
TIP Analysis check box
Select this check box to indicate the high risk analysis is to be used as the basis for Compliance Investigations for the current fiscal year.
The control is disabled when:
The screen is displayed from the Initiate Compliance Investigation screen.
Fiscal Year text and value label
This text and value label displays the current fiscal year.
The control is disabled when:
The control is always disabled.
Complete the information in the Analysis Date Range group box.
The group box includes controls to specify the date range of the analysis. The title text of the group box is set to "Analysis Date Range". The following controls are included in the group box:
From calendar control
Enter the starting date of the time frame used in the calculation for all risk indicators in this calendar control. This calendar control contains dates from the current fiscal year.
The control is disabled when:
The TIP Analysis check box is checked.
A high risk analysis is being performed.
A high risk analysis is performed from the Initiate Compliance Investigation screen.
To calendar control
Enter the ending date of the time frame used in the calculation for all risk indicators in this calendar control. This calendar control contains dates from the current fiscal year.
The control is disabled when:
The TIP Analysis check box is checked.
A high risk analysis is being performed.
A high risk analysis is performed from the Initiate Compliance Investigation screen.
Click the Analyze button to calculate the high risk score based on the time frame defined and automatically assign the various risk indicators for all vendors.
It has a mnemonic of "A".
When the button is clicked, a standard confirmation message (C0049) displays. The options of Yes and No are available. If the user clicks Yes, the alert is dismissed and the High Risk Analysis executes for the vendors. If the user clicks No, the alert is dismissed and the user is returned to the High Risk Analysis screen.
When the TIP Analysis check box is checked and the Analyze button is clicked, if an analysis was previously saved for the current fiscal year displayed in the Fiscal Year text and value label, a standard confirmation message (C0065) displays. The options of Yes and No are available. If the user clicks Yes, the alert is dismissed and the system retrieves the previously saved data and displays it in the Vendors data grid. If the user clicks No, the alert is dismissed, the high risk analysis for vendors will run, and the user is returned to the High Risk Analysis screen.
When the analysis has completed, the system displays the I0052 standard information message.
View the number of vendors marked as high risk in the Vendor data grid after analysis is complete in the High Risk Vendors text and value label.
This helps to determine if vendors need to be chosen randomly to meet the minimum percentage required. The count of high risk vendors will be updated during any recalculation or any assignment of manual risks.
Information in this control is read-only and cannot be changed. The value label displays in the inverse color of the screen.
View the total number of vendors analyzed in the Vendor data grid that are enrolled or on probation in the Total Vendors text and value label.
Information in this control is read-only and cannot be changed. The value label displays in the inverse color of the screen.
View the calculated percentage of all vendors that are enrolled or on probation that have a risk score that exceeds the high risk threshold, after analysis is complete in the Percentage text and value label.
This helps to determine if vendors need to be chosen randomly to meet the minimum percentage required. The percentage of high risk vendors will be updated during any recalculation or any assignment of manual risks.
Information in this control is read-only and cannot be changed. The value label displays in the inverse color of the screen.
View the TIP Code values that are currently being analyzed in the Analysis Progress text and value label.
The control is visible when:
The Analyze button is clicked.
It displays the text, "Please Wait. Analyzing." This is followed by the TIP Code values (HighRiskCriteria.Tip) for all high risk criteria that have their Include values set to "Y" (HighRiskCriteria.Include). As analysis is completed for all vendors for each risk criteria, the TIP Code value is removed from the label. When the last TIP Code value is removed from the value label, the label is hidden.
Information in this control is read-only and cannot be changed. The value label displays in the inverse color of the screen.
Complete the information in the Vendors group box.
The group box includes controls to view and filter the analysis. The title text of the group box is set to "Vendors". The following controls are included in the group box:
Filter Criteria group box
The group box includes controls to specify the filter criteria for the analysis. The title text of the group box is set to "Filter Criteria". The following controls are included in the group box:
Vendor drop-down list box
Select a vendor name by which to filter the Vendors data grid.
The control is disabled when:
The TIP Analysis check box is checked.
A high risk analysis is being performed.
The drop-down list box includes the names (Vendor names) of all vendors and an "<All Vendors> option that removes the vendors filter from the content of the Vendors data grid. It is the default selection.
Peer Group drop-down list box
Select a Peer Group by which to filter the Vendors data grid.
The control is disabled when:
The TIP Analysis check box is checked.
A high risk analysis is being performed.
The list will include the names (PeerGroup descriptions) of all peer groups and an "<All Peer Groups>" item that removes the peer groups filter from the content of the Vendors data grid. It is the default selection.
Corporate Parent drop-down list box
Select the corporate parent by which to filter the Vendors data grid.
The control is disabled when:
The TIP Analysis check box is checked.
A high risk analysis is being performed.
The drop-down list box will include the names (CorporateParent.Name) of all corporate parents and an "<All Corporate Parents>" item that removes the corporate parent filter from the content of the Vendors data grid. It is the default selection.
Geographic Area drop-down list box
Select a Geographic Area by which to filter the Vendors data grid.
The control is disabled when:
The TIP Analysis check box is checked.
A high risk analysis is being performed.
The list will include the names (VendorGeographicalAreas.Name) of all active geographic areas and an "<All Geographic Areas>" item that removes the geographic areas filter from the content of the Vendors data grid. It is the default selection.
Vendors data grid
This data grid is filtered using the drop-down list boxes. Based on the selections in the filters, it displays all applicable vendors and the High Risk calculation for each included TIP indicator. The data grid is read-only and is sorted by the sort order defined on the High Risk Criteria screen.
The control is disabled when:
A high risk analysis is being performed.
After an analysis is completed, the data grid will be populated with all vendors that are enrolled or on probation (the vendor's Status value in the Vendor Reference Dictionary table is "3" or "7") and their risk criteria scores. The risk criteria scores will be updated upon completion of each subsequent analysis.
If a column encounters an error during the analysis, the system does not display that column in the Vendors data grid. During the analysis run, if a column encounters an error, the system displays the I0052 standard information message.
The data grid consists of the following control(s):
Vendor ID column
This column displays the vendor identification number for each record displayed within the data grid.
The title of the column is set to "Vendor ID". The information displayed within the column is read-only. It displays the VendorID from the Vendor table.
Stamp Number column
This column displays the vendor stamp number for each record displayed within the data grid.
The title of the column is set to "Stamp Number". The information displayed within the column is read-only.
Name column
This column displays the name of each record displayed within the data grid.
The title of the column is set to "Name". The information displayed within the column is read-only.
This column identifies the trade name of each vendor analyzed.
Risk Score column
This column displays the sum of the evaluation factors for each risk element over the threshold value for each record displayed within the data grid.
The title of the column is set to "Risk Score". The information displayed within the column is read-only.
To view or edit the high risk criteria, double-click on a cell in the Risk Score column. Or, right-click and select the Edit High Risk Criterion menu option from the menu that displays. The Edit High Risk Criterion screen displays when the menu option is selected.
When previously saved results are retrieved, the Edit High Risk Criterion screen cannot be accessed.
A-Z columns
These columns display the TIP Risk Indicators analyzed for each vendor record displayed within the data grid. These correspond to the indicator mappings in The Integrity Profile (TIP) File (Output). TIP indicators are marked for inclusion on the High Risk Criteria screen. These calculated values are added and become the risk score in the Risk Score column.
The title of these columns is set to "{A-Z}". The information displayed within the columns is read-only.
Some risk indicators cannot be calculated by the system. These risk indicators can be manually assigned by selecting the check boxes provided on the Edit High Risk Criterion screen.
When previously saved results are retrieved, the Edit High Risk Criterion screen cannot be accessed.
When a calculated value exceeds the threshold, the vendor is considered High Risk based on that criterion. High Risk values display with a highlighted color on the screen. The highlight color can be modified by right-clicking any cell in the data grid and selecting the Set Highlight Color menu option. The Windows Color palette screen displays.
To view or edit the high risk criteria, double-click on a cell in any of the TIP Risk Indicator columns. Or, right-click and select the Edit High Risk Criterion menu option from the menu that displays. The Edit High Risk Criterion screen displays when the menu option is selected.
Each available high risk criteria is defined in the High Risk Criteria Definitions topic.
High Risk Criterion Details button
Click this button to view the details of the high risk criterion selected in the Vendor data grid.
The control is enabled when:
The Analyze button is clicked.
It has a mnemonic of "D".
The High Risk Criterion Details screen displays.
Initiate Compliance Investigation button
Click this button to add or view the details of a Initiate Compliance Investigation event for a vendor selected in the Vendor data grid.
The control is enabled when:
The Analyze button is clicked.
The control is disabled when:
The screen is displayed from the Initiate Compliance Investigation screen.
It has a mnemonic of "C".
The Initiate Compliance Investigation screen displays when the button is clicked.
Assign Random Risk button
Click this button to choose the percentage of vendors that must be high risk. This percentage is used if vendors need to be randomly chosen for investigation to meet the minimum percentage.
The control is enabled when:
The Analyze button is clicked.
It has a mnemonic of "R".
The Assign Random Risk screen displays.
Save Analysis Results button
Click this button to save the results of the analysis to the database.
The control is enabled when:
The Analyze button is clicked to perform an analysis on a current or future fiscal year, or when using Analysis Date Range criteria and the TIP Analysis check box is checked and the current or future year is selected.
The control is disabled when:
The screen is displayed from the Initiate Compliance Investigation screen.
The Analyze button is clicked for an Analysis Date Range and previous fiscal year retrieval runs.
It has a mnemonic of "S".
When the high risk analysis has been successfully saved, a standard information message (I0044) displays.
Only one TIP analysis high risk analysis can be saved for each fiscal year. If the user attempts to save another analysis for a fiscal year that currently has a saved analysis, a standard confirmation message (C0061) displays. The options of Yes and No are available. If the user clicks Yes, the previous TIP analysis fiscal year data is deleted and new analysis data is saved. If the user clicks No, the TIP Analysis check box is unchecked.
Export Analysis Results button
Click this button to export the analysis results to an Excel spreadsheet.
The control is enabled when:
The Analyze button is clicked.
A Windows Save File As screen displays when the button is clicked.
High Risk Criteria Used button
Click this button to view the high risk criterion used for the analysis for the saved TIP analysis.
The control is enabled when:
The Analyze button is clicked to retrieve a saved fiscal year.
The High Risk Criteria screen displays when the button is clicked.
Click the OK button to process the screen.
It is the default button for the screen, unless otherwise noted.
It does not have a mnemonic. Its keyboard shortcut is the Enter key.
The Vendor List screen displays when the button is clicked.
It does not have a mnemonic. Its keyboard shortcut is the Esc (escape) key.
The Vendor List screen displays when the button is clicked.
If data can be validated and saved on the screen, the following processes occur when the screen is processed:
A process to check for required controls as identified in the Data Map below is performed.
A process to check for valid entries as identified individually for each applicable control in Screen Elements above is performed.
A process to check for edits and cross edits as identified for each applicable control in Screen Elements above is performed.
If any checks or processes fail, a standard error message displays.
If no data can be validated and saved on the screen:
No cross edits are performed.
All values are considered legitimate.
No data is written to the database.
The Data Map defines the values saved for all controls on the screen. If available, any additional notes or comments are displayed in the Notes column.
|
Control Label |
Control Type |
Table. Column |
Notes |
|
TIP Analysis |
check box |
· |
· |
|
Fiscal Year |
text and value label |
· |
· |
|
From |
calendar control |
· |
· |
|
To |
calendar control |
· |
· |
|
High Risk Vendors |
value label |
· |
· |
|
Total Vendors |
value label |
· |
· |
|
Percentage |
value label |
· |
· |
|
Analysis Progress |
value label |
· |
· |
|
Vendor |
drop-down list box |
· |
· |
|
Peer Group |
drop-down list box |
· |
· |
|
Corporate Parent |
drop-down list box |
· |
· |
|
Geographic Area |
drop-down list box |
· |
· |
|
Vendors |
data grid label |
· |
· |
|
Vendor ID |
data grid column |
· |
· |
|
Stamp Number |
data grid column |
· |
· |
|
Name |
data grid column |
· |
· |
|
Risk Score |
data grid column |
· |
· |
|
A1 |
data grid column |
· |
· |
|
A2 |
data grid column |
· |
· |
|
B1 |
data grid column |
· |
· |
|
B2 |
data grid column |
· |
· |
|
C1 |
data grid column |
· |
· |
|
C2 |
data grid column |
· |
· |
|
D |
data grid column |
· |
· |
|
E1 |
data grid column |
· |
· |
|
F1 |
data grid column |
· |
· |
|
F2 |
data grid column |
· |
· |
|
F |
data grid column |
· |
· |
|
G1 |
data grid column |
· |
· |
|
G2 |
data grid column |
· |
· |
|
H |
data grid column |
· |
· |
|
I |
data grid column |
· |
· |
|
J |
data grid column |
· |
· |
|
K |
data grid column |
· |
· |
|
L |
data grid column |
· |
· |
|
M1 |
data grid column |
· |
· |
|
M2 |
data grid column |
· |
· |
|
N |
data grid column |
· |
· |
|
O |
data grid column |
· |
· |
|
P |
data grid column |
· |
· |
|
Q |
data grid column |
· |
· |
|
R |
data grid column |
· |
· |
|
V |
data grid column |
· |
· |
|
Z1 |
data grid column |
· |
· |
|
Z2 |
data grid column |
· |
· |
|
Z3 |
data grid column |
· |
· |
|
Z4 |
data grid column |
· |
· |
|
W |
data grid column |
· |
· |
~ Denotes a required control (if applicable). The process that checks for required controls does not occur on screens displayed in read-only or Details mode.
+ Denotes data written to the database when screen processing occurs (if applicable). The process that writes data to the database does not occur on screens displayed in read-only or Details mode.
|
Software Version: 2.40.00
![]()
