Contents Show
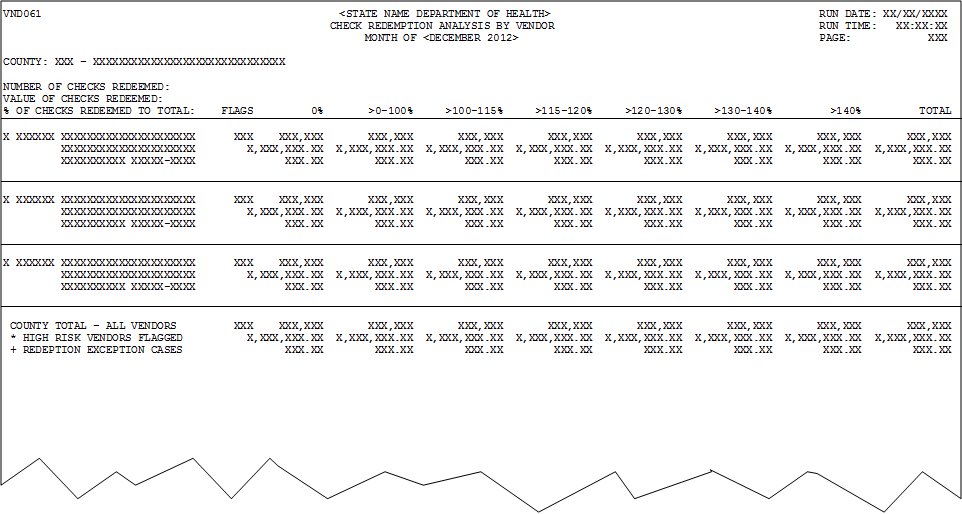
The Check Redemption Analysis by Vendor VND061 (Output) report output is generated as part of the month-end process when selected by the state. The report summarizes vendor activity for the month, is a method of identifying vendors who may be in violation of redemption rules and may be used to compare activity for vendors in the same county.
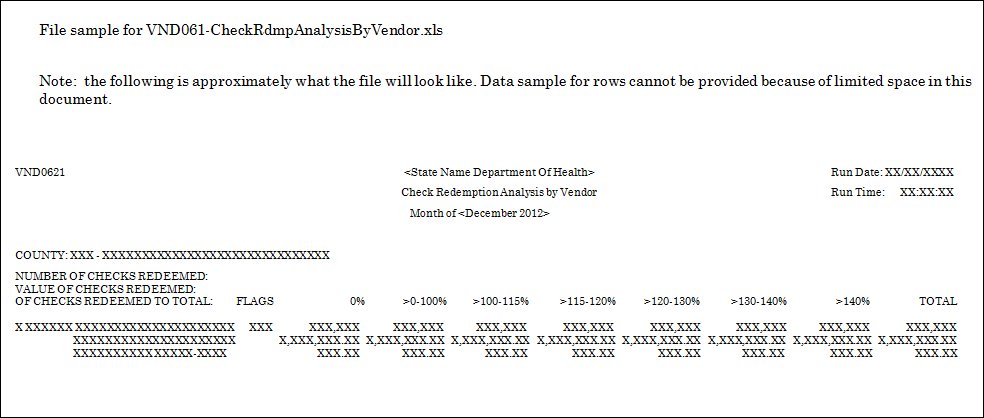
The Check Redemption Analysis by Vendor VND061 (Output) spreadsheet output is generated as part of the month-end process when selected by the state. The excel output mirrors the report output.
Data is grouped by county. For each vendor within the county the following is reported.
The format of the file is as follows:
Column B, line 1 = High Risk/Redemption Exception Flag
Column C, line 1 = Vendor ID
Column G, line 1 = Vendor Name
Column G, line 2 = Vendor Address
Column G, line 3 = City and Zip
Column X, line 1 = Flags
Column Z, line 1 = Number of Checks Redeemed - 0%
Column Z, line 2 = Value of Checks Redeemed - 0%
Column Z, line 3 = % of Checks Redeemed to Total - 0%
Column AF, line 1 = Number of Checks Redeemed - >0-100%
Column AF, line 2 = Value of Checks Redeemed - >0-100%
Column AF, line 3 = % of Checks Redeemed to Total - >0-100%
Column AM, line 1 = Number of Checks Redeemed - >100-115%
Column AM, line 2 = Value of Checks Redeemed - >100-115%
Column AM, line 3 = % of Checks Redeemed to Total - >100-115%
Column AS, line 1 = Number of Checks Redeemed - >115-120%
Column AS, line 2 = Value of Checks Redeemed - >115-120%
Column AS, line 3 = % of Checks Redeemed to Total - >115-120%
Column AY, line 1 = Number of Checks Redeemed - >120-130%
Column AY, line 2 = Value of Checks Redeemed - >120-130%
Column AY, line 3 = % of Checks Redeemed to Total - >120-130%
Column BE, line 1 = Number of Checks Redeemed - >130-140%
Column BE, line 2 = Value of Checks Redeemed - >130-140%
olumn BE, line 3 = % of Checks Redeemed to Total - >130-140%
Column BK, line 1 = Number of Checks Redeemed - >140%
Column BK, line 2 = Value of Checks Redeemed - >140%
Column BK, line 3 = % of Checks Redeemed to Total - >140%
Column BQ, line 1 = Number of Checks Redeemed - Total
Column BQ, line 2 = Value of Checks Redeemed - Total
Column BQ, line 3 = % of Checks Redeemed to Total - Total
This section describes the data elements that print on the document. The data elements are generated based on the data passed into the form; they do not map to specific database fields.
"VND061"
Format
The value is included as its literal value.
Origin of Data Element
The value is the current value of the REPORTHEADING business rule.
Format
The value is included as its literal value.
Origin of Data Element
The value is the date on which the report is generated.
Format
The value is included in the following format: MM/DD/CCYY. The value will be the current system date when the report is generated.
"Check Redemption Analysis by Vendor"
Format
The value is included as its literal value and center aligned. It is positioned at the top of the report in the center below the Report Title.
Origin of Data Element
The value is the time at which the report is generated.
Format
The value is included in the following format: HH:MM:SS (AM/PM).
Origin of Data Element
The report date range is the inclusive range of days from which the data included in the report is retrieved and includes a beginning date and an ending date.
Format
The value is center aligned and is an accounting month and year in the following format:
"Month of {month name} CCYY"
This section describes the data elements that print on the spreadsheet output. Because of space constraints, the layout may be slightly different and/or all characters may not print within the space allotted.
Origin of Data Element
The value is the current page of the report.
Format
The value is included as its literal value.
Origin of Data Element
This value is the code and name of the county from the vendors physical address. The code is the CountyCd column of the Address table where the address type equals 'Phys". The name is the Name column of the County table.
Format
This code is a three-character value. The name is a thirty-character value.
Origin of Data Element
This value is either blank, '*' or '+'. Vendors flagged as high risk will have the value '*'. Vendors flagged as redemption exceptions will have the value '+'. Otherwise the value is blank. See the data element Flags for the definition of high risk and redemption exceptions.
Format
This is a one-character value.
Origin of Data Element
This value is the VendorID column of the FoodInstrument table.
Format
This is a six-character value.
Origin of Data Element
The name value is the TradeName column of the Vendor table. The address value is taken from the Address1, City and ZipCode columns of the Address table for vendors where the address type equals 'Phys'.
Format
The name is a fifty-character value. The address is a fifty-character value. The city is a thirty-character value. The zip code is a nine-character value formatted XXXXX-XXXX.
Origin of Data Element
Vendors may be flagged as high risk or redemption exceptions. Flag is set for first criteria met.
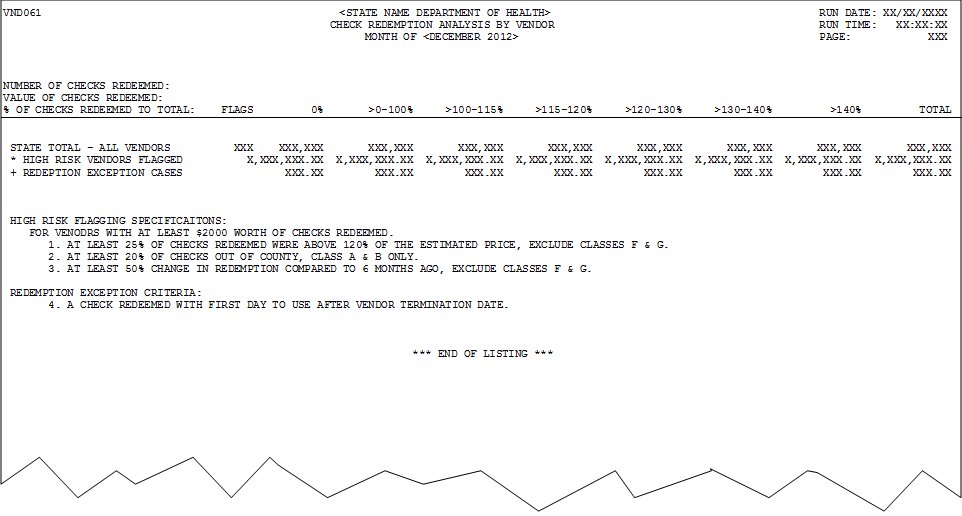
Vendors flagged as high risk must have at least $2000 worth of benefits redeemed and meet one of the following criteria.
Flag value is "1" if at least 25% of vouchers redeemed were above 120% of the obligation amount. The Pharmacy peer group (4) is excluded.
Flag value is "2" if at least 20% of the benefits were redeemed out of county.
a. A benefit is considered redeemed out of county if the county code associated with the issuing agency (AgencyID column of the FoodInstrumentSet table) is not equal to the county code associated with the vendor's physical address.
Flag value is "3" if at least 50% change in redemption compared to six months ago.
Vendors flagged as redemption exceptions must meet the following criteria.
Flag value is "4" if a benefit was redeemed with a first day to use date after the vendor termination date.
Format
This is a one-character value.
Origin of Data Element
This value is the count of benefits redeemed by the vendor, grouped by benefit ratio. The benefit ratio is calculated for each benefit and is defined as ( (the PaidAmount column of the FoodInstrument table multiplied by 100) divided by the AvgPrice column of the PeerGroupFoodInstTypePrice table). The result is not rounded. The values are grouped as follows.
Benefit ratio is 0%
Benefit ratio is greater than 0% and less than or equal to 100%
Benefit ratio is greater than 110% and less than or equal to 115%
Benefit ratio is greater than 115% and less than or equal to 120%
Benefit ratio is greater than 120% and less than or equal to 130%
Benefit ratio is greater than 130% and less than or equal to 140%
Benefit ratio is greater than 140%
The total is the total count of benefits redeemed by the vendor.
Format
This is a six-digit number.
Origin of Data Element
This value is the sum of the PaidAmount column of the FoodInstrument table for the benefits redeemed by the vendor, grouped by benefit ratio. The benefit ratio is calculated for each benefit and is defined as ( (the PaidAmount column of the FoodInstrument table multiplied by 100) divided by the AvgPrice column of the PeerGroupFoodInstTypePrice table). The result is not rounded. The values are grouped as follows.
Benefit ratio is 0%
Benefit ratio is greater than 0% and less than or equal to 100%
Benefit ratio is greater than 110% and less than or equal to 115%
Benefit ratio is greater than 115% and less than or equal to 120%
Benefit ratio is greater than 120% and less than or equal to 130%
Benefit ratio is greater than 130% and less than or equal to 140%
Benefit ratio is greater than 140%
The total is the sum of the PaidAmount column of the FoodInstrument table for benefits redeemed by the vendor.
Format
This is a seven-digit number plus two decimal places.
Origin of Data Element
This value is the percentage of benefits redeemed for the ratio. The value is calculated by dividing the Number of Checks Redeemed for the ratio divided by the Number of Checks Redeemed total. The result is multiplied times 100 and rounded to the nearest hundredth. The percentage under the total column is 100.00.
Format
This is a three-digit number plus two decimal places.
This section describes the data elements that print on the spreadsheet output. Because of space constraints, the layout may be slightly different and/or all characters may not print within the space allotted.
Origin of Data Element
This value is either blank, '*' or '+'. Vendors flagged as high risk will have the value '*'. Vendors flagged as redemption exceptions will have the value '+'. Otherwise the value is blank. See the data element Flags for the definition of high risk and redemption exceptions.
Format
This is a one-character value.
Origin of Data Element
This value is the VendorID column of the FoodInstrument table.
Format
This is a six-character value.
Origin of Data Element
The name value is the TradeName column of the Vendor table. .
Format
The name is a fifty-character value.
Origin of Data Element
The address value is taken from the Address1 column of the Address table for vendors where the address type equals 'Phys'.
Format
The address is a fifty-character value.
Origin of Data Element
The city and zip code values are taken from the City and ZipCode columns of the Address table for vendors where the address type equals 'Phys'.
Format
The city is a thirty-character value. The zip code is a nine-character value formatted XXXXX-XXXX.
Origin of Data Element
Vendors may be flagged as high risk or redemption exceptions. Flag is set for first criteria met.
Vendors flagged as high risk must have at least $2000 worth of benefits redeemed and meet one of the following criteria.
Flag value is "1" if at least 25% of vouchers redeemed were above 120% of the obligation amount. The Pharmacy peer group (4) is excluded.
Flag value is "2" if at least 20% of the benefits were redeemed out of county.
a. A benefit is considered redeemed out of county if the county code associated with the issuing agency (AgencyID column of the FoodInstrumentSet table) is not equal to the county code associated with the vendor's physical address.
Flag value is "3" if at least 50% change in redemption compared to six months ago.
Vendors flagged as redemption exceptions must meet the following criteria.
Flag value is "4" if a benefit was redeemed with a first day to use date after the vendor termination date.
Format
This is a one-character value.
Origin of Data Element
This value is the count of benefits redeemed by the vendor, where the benefit ratio is 0%. The benefit ratio is calculated for each benefit and is defined as ( (the PaidAmount column of the FoodInstrument table multiplied by 100) divided by the AvgPrice column of the PeerGroupFoodInstTypePrice table). The result is not rounded.
Format
This is a six-digit number.
Origin of Data Element
This value is the sum of the PaidAmount column of the FoodInstrument table for the benefits redeemed by the vendor, where the benefit ratio is 0%. The benefit ratio is calculated for each benefit and is defined as ( (the PaidAmount column of the FoodInstrument table multiplied by 100) divided by the AvgPrice column of the PeerGroupFoodInstTypePrice table). The result is not rounded.
Format
This is a seven-digit number plus two decimal places.
Origin of Data Element
This value is the percentage of benefits redeemed for the ratio. The value is calculated by dividing the Number of Checks Redeemed - 0% divided by the Number of Checks Redeemed total. The result is multiplied times 100 and rounded to the nearest hundredth.
Format
This is a three-digit number plus two decimal places.
Origin of Data Element
This value is the count of benefits redeemed by the vendor, where the benefit ratio is >0-100%. The benefit ratio is calculated for each benefit and is defined as ( (the PaidAmount column of the FoodInstrument table multiplied by 100) divided by the AvgPrice column of the PeerGroupFoodInstTypePrice table). The result is not rounded.
Format
This is a six-digit number.
Origin of Data Element
This value is the sum of the PaidAmount column of the FoodInstrument table for the benefits redeemed by the vendor, where the benefit ratio is >0-100%. The benefit ratio is calculated for each benefit and is defined as ( (the PaidAmount column of the FoodInstrument table multiplied by 100) divided by the AvgPrice column of the PeerGroupFoodInstTypePrice table). The result is not rounded.
Format
This is a seven-digit number plus two decimal places.
Origin of Data Element
This value is the percentage of benefits redeemed for the ratio. The value is calculated by dividing the Number of Checks Redeemed - >0-100% divided by the Number of Checks Redeemed total. The result is multiplied times 100 and rounded to the nearest hundredth.
Format
This is a three-digit number plus two decimal places.
Origin of Data Element
This value is the count of benefits redeemed by the vendor, where the benefit ratio is >100-115%. The benefit ratio is calculated for each benefit and is defined as ( (the PaidAmount column of the FoodInstrument table multiplied by 100) divided by the AvgPrice column of the PeerGroupFoodInstTypePrice table). The result is not rounded.
Format
This is a six-digit number.
Origin of Data Element
This value is the sum of the PaidAmount column of the FoodInstrument table for the benefits redeemed by the vendor, where the benefit ratio is >100-115%. The benefit ratio is calculated for each benefit and is defined as ( (the PaidAmount column of the FoodInstrument table multiplied by 100) divided by the AvgPrice column of the PeerGroupFoodInstTypePrice table). The result is not rounded.
Format
This is a seven-digit number plus two decimal places.
Origin of Data Element
This value is the percentage of benefits redeemed for the ratio. The value is calculated by dividing the Number of Checks Redeemed - >100-115% divided by the Number of Checks Redeemed total. The result is multiplied times 100 and rounded to the nearest hundredth.
Format
This is a three-digit number plus two decimal places.
Origin of Data Element
This value is the count of benefits redeemed by the vendor, where the benefit ratio is >115-120%. The benefit ratio is calculated for each benefit and is defined as ( (the PaidAmount column of the FoodInstrument table multiplied by 100) divided by the AvgPrice column of the PeerGroupFoodInstTypePrice table). The result is not rounded.
Format
This is a six-digit number.
Origin of Data Element
This value is the sum of the PaidAmount column of the FoodInstrument table for the benefits redeemed by the vendor, where the benefit ratio is >115-120%. The benefit ratio is calculated for each benefit and is defined as ( (the PaidAmount column of the FoodInstrument table multiplied by 100) divided by the AvgPrice column of the PeerGroupFoodInstTypePrice table). The result is not rounded.
Format
This is a seven-digit number plus two decimal places.
Origin of Data Element
This value is the percentage of benefits redeemed for the ratio. The value is calculated by dividing the Number of Checks Redeemed - >115-120% divided by the Number of Checks Redeemed total. The result is multiplied times 100 and rounded to the nearest hundredth.
Format
This is a three-digit number plus two decimal places.
Origin of Data Element
This value is the count of benefits redeemed by the vendor, where the benefit ratio is >120-130%. The benefit ratio is calculated for each benefit and is defined as ( (the PaidAmount column of the FoodInstrument table multiplied by 100) divided by the AvgPrice column of the PeerGroupFoodInstTypePrice table). The result is not rounded.
Format
This is a six-digit number.
Origin of Data Element
This value is the sum of the PaidAmount column of the FoodInstrument table for the benefits redeemed by the vendor, where the benefit ratio is >120-130%. The benefit ratio is calculated for each benefit and is defined as ( (the PaidAmount column of the FoodInstrument table multiplied by 100) divided by the AvgPrice column of the PeerGroupFoodInstTypePrice table). The result is not rounded.
Format
This is a seven-digit number plus two decimal places.
Origin of Data Element
This value is the percentage of benefits redeemed for the ratio. The value is calculated by dividing the Number of Checks Redeemed - >120-130% divided by the Number of Checks Redeemed total. The result is multiplied times 100 and rounded to the nearest hundredth.
Format
This is a three-digit number plus two decimal places.
Origin of Data Element
This value is the count of benefits redeemed by the vendor, where the benefit ratio is >130-140%. The benefit ratio is calculated for each benefit and is defined as ( (the PaidAmount column of the FoodInstrument table multiplied by 100) divided by the AvgPrice column of the PeerGroupFoodInstTypePrice table). The result is not rounded.
Format
This is a six-digit number.
Origin of Data Element
This value is the sum of the PaidAmount column of the FoodInstrument table for the benefits redeemed by the vendor, where the benefit ratio is >130-140%. The benefit ratio is calculated for each benefit and is defined as ( (the PaidAmount column of the FoodInstrument table multiplied by 100) divided by the AvgPrice column of the PeerGroupFoodInstTypePrice table). The result is not rounded.
Format
This is a seven-digit number plus two decimal places.
Origin of Data Element
This value is the percentage of benefits redeemed for the ratio. The value is calculated by dividing the Number of Checks Redeemed - >130-140% divided by the Number of Checks Redeemed total. The result is multiplied times 100 and rounded to the nearest hundredth.
Format
This is a three-digit number plus two decimal places.
Origin of Data Element
This value is the count of benefits redeemed by the vendor, where the benefit ratio is >140%. The benefit ratio is calculated for each benefit and is defined as ( (the PaidAmount column of the FoodInstrument table multiplied by 100) divided by the AvgPrice column of the PeerGroupFoodInstTypePrice table). The result is not rounded.
Format
This is a six-digit number.
Origin of Data Element
This value is the sum of the PaidAmount column of the FoodInstrument table for the benefits redeemed by the vendor, where the benefit ratio is >140%. The benefit ratio is calculated for each benefit and is defined as ( (the PaidAmount column of the FoodInstrument table multiplied by 100) divided by the AvgPrice column of the PeerGroupFoodInstTypePrice table). The result is not rounded.
Format
This is a seven-digit number plus two decimal places.
Origin of Data Element
This value is the percentage of benefits redeemed for the ratio. The value is calculated by dividing the Number of Checks Redeemed - >140% divided by the Number of Checks Redeemed total. The result is multiplied times 100 and rounded to the nearest hundredth.
Format
This is a three-digit number plus two decimal places.
Origin of Data Element
This value is the total count of benefits redeemed by the vendor.
Format
This is a six-digit number.
Origin of Data Element
This value is the sum of the PaidAmount column of the FoodInstrument table for benefits redeemed by the vendor.
Format
This is a seven-digit number plus two decimal places.
Origin of Data Element
This value is 100.00.
Format
This is a three-digit number plus two decimal places.
Benefits with a paid date within the selected month are included in the report. Vendors are reported in the county of their physical address. Benefits must meet one of the following selection criteria.
The PaidDate column of the FoodInstrument table is within the selected month.
The VendorID column of the FoodInstrument table is not null.
The report will be sorted first by county code.
The report will be sorted by vendor ID within county code.
Totals for the county will print.
State totals will print at the end of the report. For the report output, state totals will print on a separate page.
If selected by the state, this system output is generated during the month-end process.
|
Software Version: 2.40.00
![]()