Contents Show
The Cost Neutrality Spreadsheet contains multiple worksheets that divide the food instrument type data being reported into groups based on the number of benefits redeemed within the selected reporting period for each food instrument type. The groupings are: More than 100 benefits redeemed, 50 - 100 benefits redeemed, 25 - 49 benefits redeemed, and 10 - 24 benefits redeemed. Less than 10 redeemed are not reported because the sample size is too small to give meaningful statistical results for calculations included in the output. Each of the groupings just described has two sheets within the spreadsheet. The first of the two contains the results of the calculations for both above 50% vendors and for regular vendors along with the outcome. The second sheet contains the food instrument type detail that supports the results reported on the first sheet. The 4 pairs of outcome and detail sheets are followed by a Summary sheet and a FI Type Item Description sheet.
The outcome and detail sheets are followed by the summary and the food instrument type detail sheets. The summary is produced if the time period selected on the generate dialog is the fourth quarter of the fiscal year. The sheet will contain any food instrument types having outcomes calculated as being statistically significantly higher for above 50% vendors. The food instrument type detail is provided for any food instrument type reported on the outcome sheets. The report is generated when the OK button is clicked on the Generate Cost Neutrality Spreadsheet screen.
This section describes the data elements that print on the system output. Because of space constraints, the layout may be slightly different and/or all characters may not print within the space allotted.
Origin of Data Element
The text for the outcome sheets will be one of the following depending on how many redeemed food instruments are being reported on the sheet.
More than 100
More than 100 Detail
50 to 100 FI
50 to 100 FI Detail
25 to 49 FI
25 to 49 FI Detail
10 to 24 FI
10 to 24 FI Detail
Format
The cell value will print as a literal value.
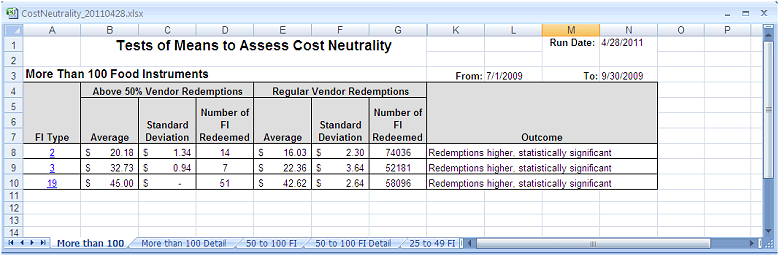
"Tests of Means to Assess Cost Neutrality"
Format
The title cell value will print as a literal value.
Origin of Data Element
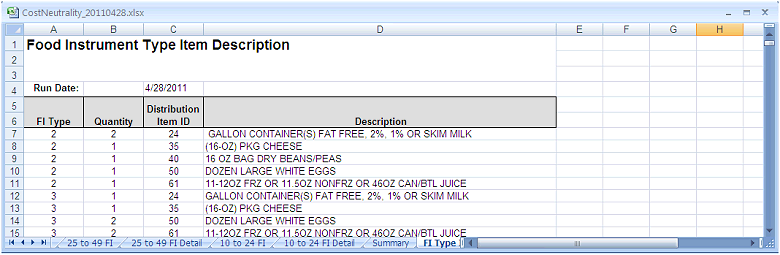
The value is the date on which the report is generated.
Format
The value is included in the following format: MM/DD/CCYY. The value will be the current system date when the report is generated.
Origin of Data Element
The text for the sheet title will be one of the following depending on how many redeemed food instruments are being reported on the sheet.
More than 100 Food Instruments
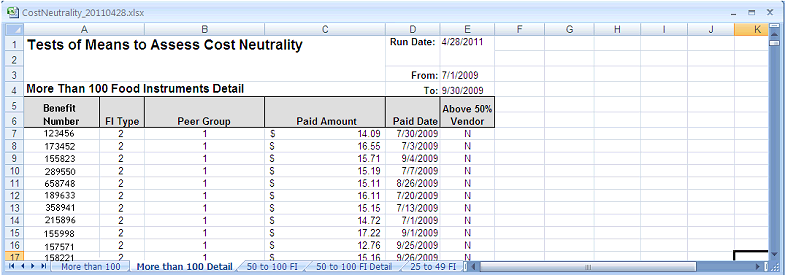
More than 100 Food Instruments Detail
50 to 100 Food Instruments
50 to 100 Food Instruments Detail
25 to 49 Food Instruments
25 to 49 Food Instruments Detail
10 to 24 Food Instruments
10 to 24 Food Instruments Detail
Format
The title cell value will print as a literal value.
Origin of Data Element
The text value will be set to the From date entered on the Generate Cost Neutrality Spreadsheet screen or will be the starting date of the quarter selected on the Generate Cost Neutrality Spreadsheet screen.
Format
The format is MM/DD/CCYY and will be displayed based on the format selected for the cell where it is displayed.
Origin of Data Element
The text value will be set to the To date entered on the Generate Cost Neutrality Spreadsheet screen or will be the ending date of the quarter selected on the Generate Cost Neutrality Spreadsheet screen.
Format
The format is MM/DD/CCYY and will be displayed based on the format selected for the cell where it is displayed.
Origin of Data Element
FI types displayed must have had the required number of food instruments (for the sheet) redeemed during the selected date range either by the above 50% vendors or by regular vendors. For example, for FI type 2 to appear on the "More than 100 Food Instruments" outcome sheet, there were 74,036 food instruments of this FI type redeemed within the date range by regular vendors. Only 14 were redeemed in the date range by the above 50% vendors.
Format
The FI Type ID will be displayed in the cell as a hyperlink. Each FI type will have hover text showing the quantity and the distribution item description for each item associated with the FI type. When the FI type hyperlink is activated, the system will display the FI Type Description tab of the spreadsheet with the first cell in the first row of data for that FI type selected.
Average
The average cost of the food instruments selected for the above 50% vendors section. The calculation will be done using the T-SQL AVG function for the paid amount of the selected food instruments.
Standard Deviation
The standard deviation of the food instruments selected for the above 50% vendors section. The calculation will be done using the T-SQL STDEV function for the paid amount of the selected food instruments.
Number of FI Redeemed
The count of food instruments having the FI type shown in column A redeemed by above 50% vendors during the time period selected on the Generate Cost Neutrality Spreadsheet screen.
Average
The average cost of the food instruments selected for the regular vendors section. The calculation will be done using the T-SQL AVG function for the paid amount of the selected food instruments.
Standard Deviation
The standard deviation of the food instruments selected for the regular vendors section. The calculation will be done using the T-SQL STDEV function for the paid amount of the selected food instruments.
Number of FI Redeemed
The count of food instruments having the FI type shown in column A redeemed by regular vendors during the time period selected on the Generate Cost Neutrality Spreadsheet screen.
Origin of Data Element
The outcome is the result of an internal calculation. Three possible outcomes could be reported in this cell: No Data, Not Higher, Redemptions Higher; Statistically Significant. The calculation should not occur if either the above 50% vendor columns contain no data or the regular vendor columns contain no data.
Origin of Data Element
Calculations on the outcome sheets are done according to the sample spreadsheet supplied by FNS. Each one is shown separately below.
For each row the formulas are altered to reflect the appropriate row. C8, F8, etc. for row 8 while row 9 would be C9, F9, etc.
Each sheet uses the same formula for columns H, I, and J but column K is slightly different for each sheet: J8>1.645 vs. J8>1.66 vs. J8>1.676 vs. J8>1.711
More than 100
Column H: =(C8^2)/D8
Column I: =(F8^2)/G8
Column J: =(B8-E8)/SQRT(H8+I8)
Column K: =IF(G8="","No data",IF(J8>1.645,"Redemptions higher, statistically significant","Not higher"))
50 to 100 FI
Column H: =(C8^2)/D8
Column I: =(F8^2)/G8
Column J: =(B8-E8)/SQRT(H8+I8)
Column K: =IF(G8="","No data",IF(J8>1.66,"Redemptions higher, statistically significant","Not higher"))
25 to 49 FI
Column H: =(C8^2)/D8
Column I: =(F8^2)/G8
Column J: =(B8-E8)/SQRT(H8+I8)
Column K: =IF(G8="","No data",IF(J8>1.676,"Redemptions higher, statistically significant","Not higher"))
10 to 24 FI
Column H: =(C8^2)/D8
Column I: =(F8^2)/G8
Column J: =(B8-E8)/SQRT(H8+I8)
Column K: =IF(G8="","No data",IF(J8>1.711,"Redemptions higher, statistically significant","Not higher"))
Origin of Data Element
Benefit Number will be set to the serial number of the benefit being reported as redeemed in the selected period
Origin of Data Element
FI Type will be set to the FI Type ID from the redeemed food instruments being reported
Origin of Data Element
Peer Group will be set to the peer group ID assigned to the vendor where the food instruments being reported were redeemed
Origin of Data Element
Paid Amount will be set to the sum of the paid amounts of food instruments redeemed for the given FI type ID, peer group and paid date for food instruments being reported.
Format
The amount will be formatted as a currency field.
Origin of Data Element
Paid Date will be set to the paid date of the redeemed food instruments being reported for the selected date range.
Format
The date will be formatted as a date field to display as close to the standard MM/DD/CCYY as possible.
Origin of Data Element
Above 50% Vendor will be set to "Y" if the data represented on the row is associated with an above 50% vendor or will be set to "N" if the data represented on the row is not associated with an above 50% vendor.
Origin of Data Element
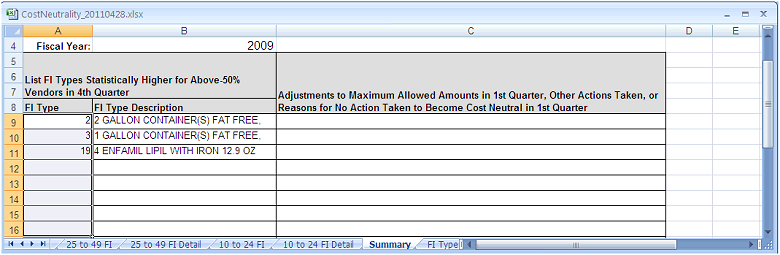
The text for the summary spreadsheet title is "Summary of Quarterly Cost Neutrality Assessment for 4th Quarter and Follow-up in 1st Quarter".
Format
The title cell value will print as a literal value.
Origin of Data Element
The text will contain the fiscal year selected on the Generate Cost Neutrality Spreadsheet screen.
Format
The cell value will print as a literal value.
Text 1
The text for the heading is "List FI Types Statistically Higher for Above 50% Vendors in 4th Quarter".
Text 2
The text for the heading is "Adjustments to Maximum Allowed Amounts in 1st Quarter, Other Actions Taken, or Reasons for No Action Taken to Become Cost Neutral in 1st Quarter".
FI Type
FI Type will contain the FI Types shown on the Outcome sheet(s) to be statistically higher in price than regular vendors.
Origin of Data Element
FI Type will contain the food instrument type ID selected to be included on the Outcome tabs for the food instrument types that having outcomes calculated as being statistically significantly higher for above 50% vendors.
Format
Can be expanded by hovering over a cell in the FI Type Description column.
Origin of Data Element
The description including quantity and food distribution item description combinations that define the FI Type shown on the associated row.
Format
The cell value will print as a literal value.
Origin of Data Element
FI Type will contain the food instrument type ID selected to be included on the Outcome tabs.
Format
The cell value will print as a literal value.
Origin of Data Element
Quantity will contain the quantity of the food distribution item that is included in the food instrument type definition.
Origin of Data Element
Distribution Item ID will contain the distribution item ID that is included in the food instrument type definition.
Origin of Data Element
Description will contain the food distribution item description associated with the reported distribution item ID.
The initial base of date consists of two data sets (A and B) that must be extracted before the system derives the final content. Set A is the collection of data by the food instrument type for vendors that are flagged as above 50 percent. Set B is the collection of data by the food instrument type for vendors that are not flagged as above 50 percent. Data selected for the report includes the data for food instrument types that exist in both of sets of data.
Set A: Benefit data for food instrument type where the benefit meets the following selection criteria (vendors flagged as above 50 percent)
The Above50PercentValue column of the Vendor table equals "Y" for the vendor that redeemed the food instrument.
PaidDate column of the FoodInstrumentTable is between selected From and To dates.
The DateInitContract column of the Vendor table is less than or equal to the selected To Date for the vendor that redeemed the food instrument.
The vendor that redeemed the food instrument is not terminated or disqualified before the end of the selected date range.
The vendor that redeemed the food instrument does not have a record in the Event table where the StartDate column of the Event table is less than or equal to the selected To Date and the Type column of the Event table equals "8" or "25" (Termination or Disqualification).
The vendor that redeemed the food instrument does not have a record in the FollowUpActivity table where the StartDate column of the FollowUpActivity table is less than or equal to the selected To Date and the Type column of the FollowUpActivity table equals "8" or "25" (Termination or Disqualification).
Set B: Benefit data for food instruments by food instrument type where the benefit meets the following selection criteria (vendors not flagged as above 50 percent)
The Above50PercentValue column of the Vendor table equals "N" for the vendor that redeemed the food instrument.
PaidDate column of the FoodInstrumentTable is between selected From and To dates.
The DateInitContract column of the Vendor table is less than or equal to the selected To Date for the vendor that redeemed the food instrument.
The vendor that redeemed the food instrument is not terminated or disqualified before the end of the selected date range.
The vendor that redeemed the food instrument does not have a record in the Event table where the StartDate column of the Event table is less than or equal to the selected To Date and the Type column of the Event table equals "8" or "25" (Termination or Disqualification).
The vendor that redeemed the food instrument does not have a record in the FollowUpActivity table where the StartDate column of the FollowUpActivity table is less than or equal to the selected To Date and the Type column of the FollowUpActivity table equals "8" or "25" (Termination or Disqualification).
Selected records will include the records selected from Set A and Set B based on the following criteria.
The FoodInstrumentType column of the FoodInstrument table must exist in both A and B data sets defined above.
Between data for Set A and Set B, determine the lower count of food instrument for each food instrument type. In order for the food instrument to be selected, the lower count of food instruments for the food instrument type must be between the lower and upper boundaries for the selected worksheet tab.
10 and 24, inclusive
25 and 49, inclusive
50 and 100, inclusive
More than 100
The data on this worksheet will be sorted by FI Type.
The data on this worksheet will be sorted by Benefit Number.
Sort order is not applicable to this worksheet.
The data on this worksheet will be sorted by FI Type then Distribution Item ID.
|
Software Version: 2.40.00
![]()