Contents Show
The Pre-pregnancy BMI tab allows the user to view the prenatal weight gain grid for the height/weight measurements taken during the pregnancy period for a participant with the WIC Category of Pregnant. Additionally, the grid can be viewed for the height/weight measurements taken during the average 280-day duration of a pregnancy for a female participant with the WIC Category of Breastfeeding or Non-breastfeeding if she was certified as Pregnant during the most recent pregnancy. This section describes the on-screen view of the grid as well as the printed output.
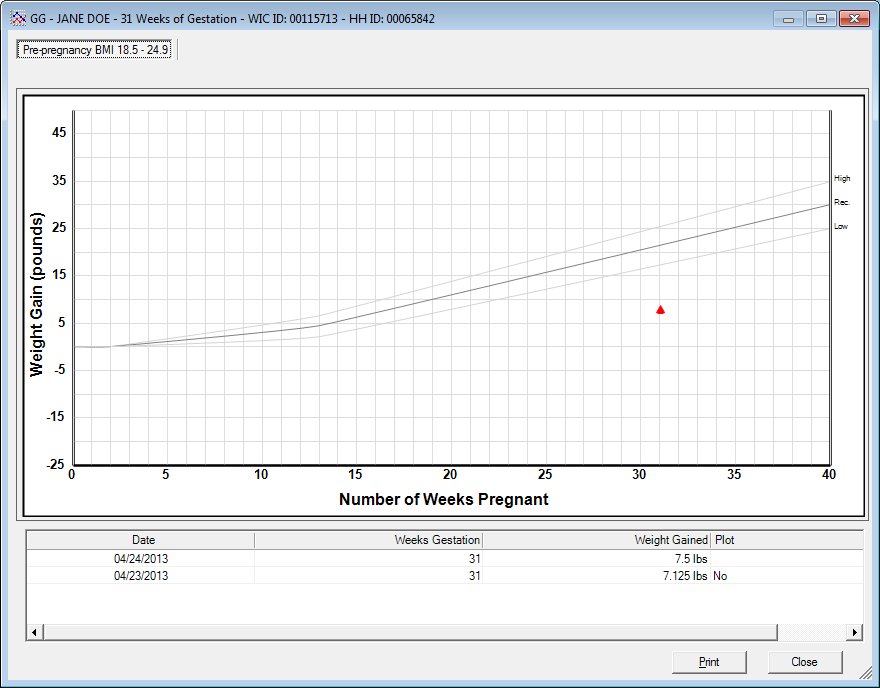
Pre-pregnancy BMI screen
|
|
|
Unless otherwise stated below, all controls on the Pre-pregnancy BMI screen are visible and enabled when:
The screen is active.
If one or more special conditions exist that affect a control on the Pre-pregnancy BMI screen, the condition(s) are documented for that specific control below.
View the title of the printed output growth grid (for printed outputs only).
The title prints on the grid to indicate the type of measurements plotted. The title prints as the literal text to represent the grid. If the participant is plotted as underweight, the text prints the following:
"{REPORTHEADING} Pre-pregnancy BMI < 18.5"
If the participant is plotted as normal weight, the text prints the following:
"{REPORTHEADING} Pre-pregnancy BMI 18.5 - 24.9"
If the participant is plotted as overweight, the text prints the following:
"{REPORTHEADING} Pre-pregnancy BMI 25.0 - 29.9".
If the participant is plotted as obese, the text prints the following:
"{REPORTHEADING} Pre-pregnancy BMI >=30".
The {REPORTHEADING} text is pulled from the REPORTHEADING business rule for the client.
View the footnote of the printed output growth grid (for printed outputs only).
The footnote prints on the grid to identify the participant whose measurements are plotted, and to indicate the date on which the growth grid was created. The footnote displays as the text of "Member.LastName, Member.First Name Member.MiddleInitial. - Date created: {current system date in MM/DD/CCYY format}".
View the low, recommended and high curves on the growth grid.
There are 3 curves printed on the prenatal growth grid from bottom line to top with additional text to represent Low, Recommended and High. The bottom line displays text of "Low". The middle line displays text of "Rec." (for recommended) and the top line displays text of "High".
View the data points collection on the growth grid.
The growth grid contains zero (0) or more data points showing the measurement taken at a particular point in time. If the measurement is on the weight gain line or within the appropriate weight gain range as indicated by the lines on the grid, the measurement is plotted with a blue circle. If the measurement is outside these lines (either above or below), it is plotted as a red triangle.
View the data point joining line on the growth grid.
The data points on the growth grid are connected by a "joining line" to indicate the growth of the participant. The line displays in black. It has end points equal to the two adjoining data points that it connects. It has a slope equal to the difference of the vertical axis divided by the difference of the horizontal axis for the two data points.
View the vertical axis on the growth grid.
The vertical axis of the growth grid allows the user to reference the scale of the measurements plotted on the growth grid. The axis has a major division of 10 units and a minor division of 5 units. The minimum value of the axis is -25 and the maximum value is 45. The title for the axis is the text "Weight Gain (pounds)". It displays in the color black.
View the horizontal axis on the growth grid.
The horizontal axis of the growth grid allows the user to reference the category of the measurements plotted on the growth grid. The axis has a major division of 5 units and a minor division of 1 unit. The minimum value of the axis is 0 and the maximum value is 40. The title for the axis is the text "Number of Weeks Pregnant". It displays in the color black.
View the information in the Detail data grid.
This data grid displays the detailed information for the measurement points plotted on the growth grid currently displayed in the Growth Grid pane. The columns of information displayed in the data grid vary depending upon the specific tab selected in the Growth Grid pane. The Detail data grid displays the detail information for each measurement plot plotted on the chart.
The data grid consists of the following control(s):
Date column
This column displays the date on which the record was recorded for each record displayed within the data grid.
The title of the column is set to "Date". The information displayed within the column is read-only.
The column header and data are center aligned.
Weeks Gestation column
This column displays the number of weeks of gestation for each record displayed within the data grid.
The title of the column is set to "Weeks Gestation". The information displayed within the column is read-only.
The column header and data are right aligned.
Weight Gained column
This column displays the weight gained by the participant for each record displayed within the data grid. A "lbs" abbreviation displays to the right of each weight gained value displayed.
The title of the column is set to "Weight Gained". The information displayed within the column is read-only. The value displays in pounds.
The column header and data are right aligned.
Plot column
This column indicates if the measurement will be plotted on the Growth Grids for each record displayed within the data grid.
The title of the column is set to "Plot". The information displayed within the column is read-only.
If a height/weight record is flagged as "Do Not Plot", the value displayed in the Plot column is "No". If the height/weight record is marked is not flagged as "Do Not Plot", the Plot column is blank. The value displayed in the Plot column is independent of the Possible Incorrect Measurement Reason and the Measurement Source.
The column header and data are left aligned.
Click the Print button to print the currently displayed growth grid and its associated data.
It has a mnemonic of "P".
It does not have a mnemonic. Its keyboard shortcut is the Esc (escape) key.
The Height/Weight and Blood Work Information screen displays when the button is clicked.
If data can be validated and saved on the screen, the following processes occur when the screen is processed:
A process to check for required controls as identified in the Data Map below is performed.
A process to check for valid entries as identified individually for each applicable control in Screen Elements above is performed.
A process to check for edits and cross edits as identified for each applicable control in Screen Elements above is performed.
If any checks or processes fail, a standard error message displays.
If no data can be validated and saved on the screen:
No cross edits are performed.
All values are considered legitimate.
No data is written to the database.
The Data Map defines the values saved for all controls on the screen. If available, any additional notes or comments are displayed in the Notes column.
|
Control Label |
Required |
Table |
Column |
Notes |
|
· |
· |
· |
· |
· |
|
· |
· |
· |
· |
· |
|
· |
· |
· |
· |
· |
|
· |
· |
· |
· |
· |
|
· |
· |
· |
· |
· |
|
Software Version: 2.40.00
![]()
